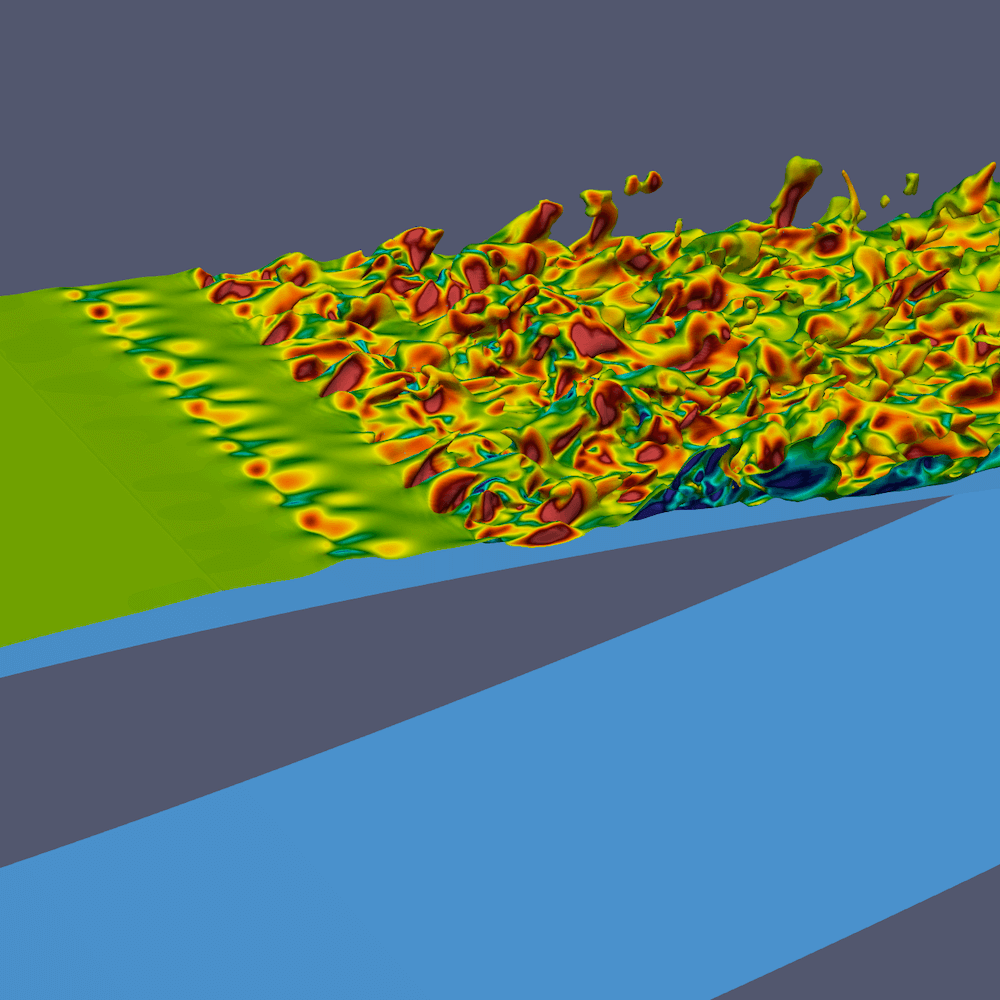
These visualizations by Alex Razoumov are from the 2019 Visualize This! competition. The 3D computational fluid dynamics (CFD) dataset in this competition kindly provided by Joshua Brinkerhoff (UBC Okanagan) comes from an OpenFOAM numerical simulation of incompressible transitional air flow over a wind turbine section. The fluid is treated incompressible due to the low Mach number. The airfoil is NACA0018, a common research airfoil used to study wind turbine aerodynamics.
Below, we provide a simple rendering of the velocity magnitude done with ParaView on the Cedar cluster. The entire visualization with 286 frames took about 20 minutes to render on 64 CPU cores, with most time spent on the time-dependent part towards the end of the video where we had to read each timestep from disk.
The second clip provides a more detailed look at the separation of the laminar boundary layer from the airfoil surface and its transition to turbulence. This more complex rendering showing the isosurface of constant air speed coloured by the Y-component of the vorticity took 17 minutes on 128 CPU cores on Cedar.