Ice-water system
These visualizations by Dmitri Rozmanov and Peter Kusalik (University of Calgary) demonstrate how discrete atoms and molecules can be visualized with a continuous 3D renderer, in this case ParaView.
Water density in ice/water simulation
This animation shows the time evolution of the density of water molecules in a molecular simulation of ice/water system during ice melting. The density is represented by a set of isosurfaces coloured from blue (low density) to red (high density). The density from each frame is sampled over 2 ps and averaged over 5 frames for smooth animation. The appearance of continuous single molecule translations in the liquid phase seen as elongated density “beans” indicate that 10 ps is the diffusion timescale in the liquid water under these conditions.
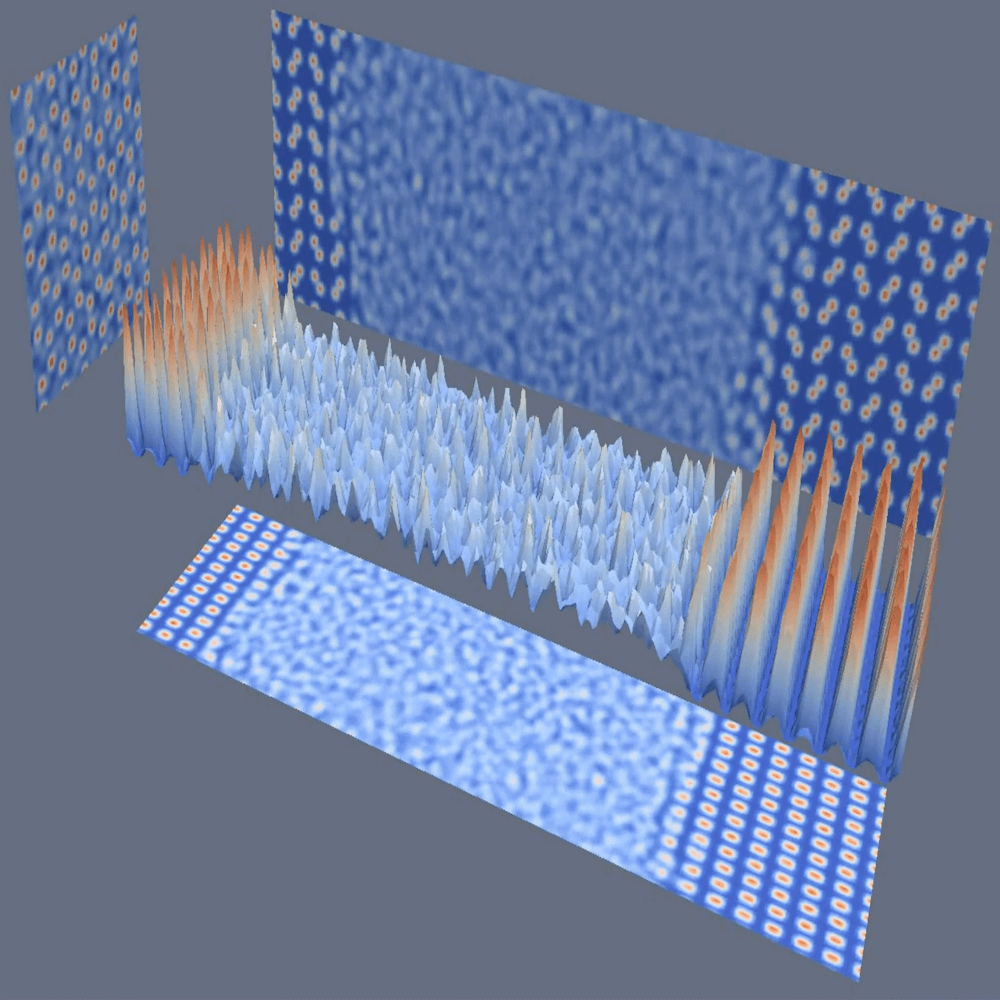
Projections of 3D water density in ice/water simulation
This animation shows the time evolution of the projections of the density of water molecules onto the three orthogonal planes in a molecular simulation of ice/water system during ice melting. The projections are coloured by the density values from blue (low) to red (high). The XZ projection is also shown as an animated carpet plot using the same colouring. The density from each frame is sampled over 2 ps and averaged over 5 frames for smooth animation.
Ice/water interface surface from molecular simulation
The animation shows the time evolution of the interface surface between ice and water in molecular simulations at the melting temperature. The interface was defined as the isosurface of a density-based order parameter for water molecules computed on a 3D grid with 0.5 Angstrom resolution. The ice phase was below the surface and the liquid phase was above the surface. The water density for the surface extraction was sampled over 10 ps and smoothed over 10 frames. The shown cross-section is 45x47 Angstrom. The animation demonstrates the dynamic character of the interface near the melting temperature.