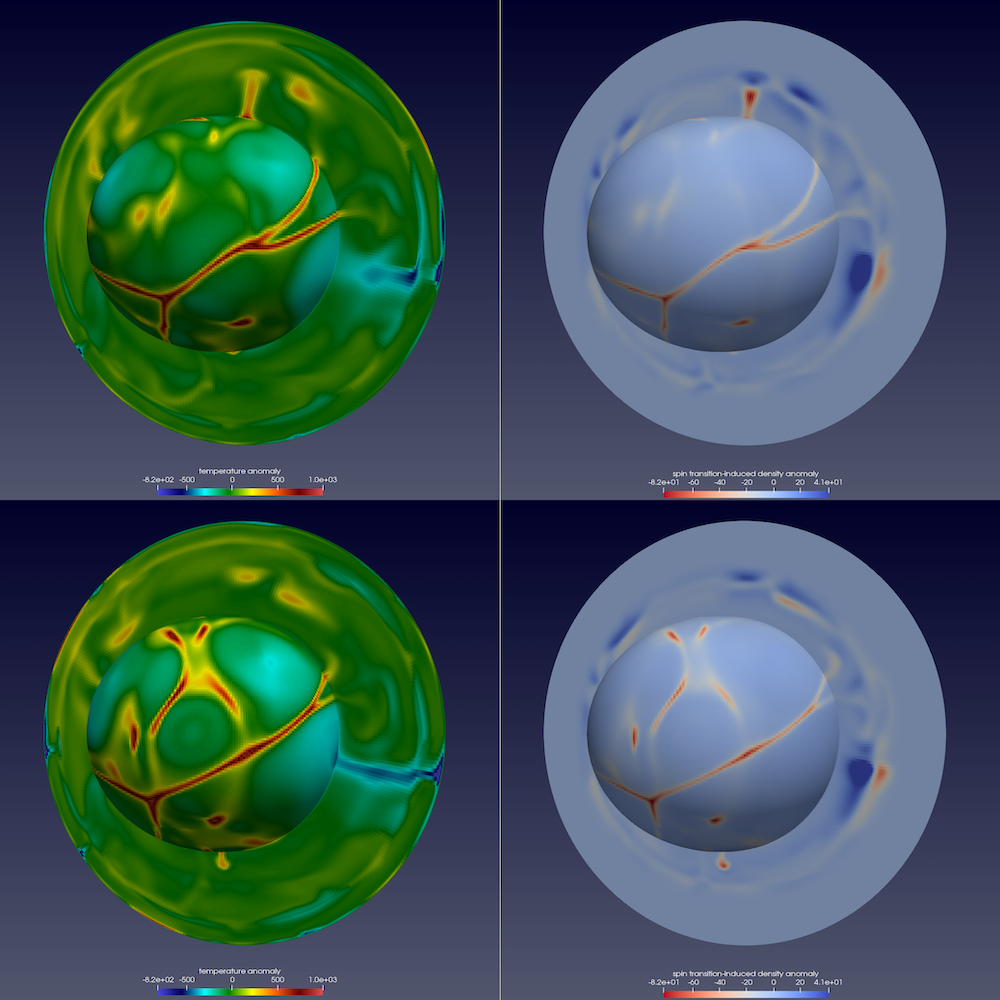
These visualizations by Alex Razoumov are from the 2021 IEEE SciVis Contest setup. This image above shows the temperature anomaly (left) and the corresponding spin transition-induced density anomaly (right) at two timesteps separated by 20 Myrs (earlier at the top) in a cross-section and at the inner, core-mantle boundary. You can see a descending cold slab that becomes first lighter and then heavier (red and blue regions on the right panels) which can initially slow and then accelerate the mantle flow at mid-mantle depths (bottom left panel). You can see similar effects in the hot rising plumes. These two effects can cause plume or slab stagnation at mid-mantle depths with subsequent sudden avalanches.
The clip below shows the temperature and velocity over the first 200 Myrs of the simulation.